Stock Market 101
Any way to predict the future value of a stock leads to an opportunity to make money - if we can predict the value to increase, then we can sell at the higher price for a profit. Likewise, if we can predict the stock value to decrease, we can sell now to reduce our losses.
I have been following the stock markets passively since the beginning of 2020*. One thing I have noticed is that when a stock has a particularly good day one day, it tends to have a particularly bad day the next day. I wondered if it is a real effect, or if my opinion is subjective based on a subconscious bias.
* I enjoy maths, coding and difficult technical challenges - the finance industry is the obvious place to apply these interests!
A good example of such a volatile stock is Tesla, as shown in the image below. Note the movements around September 2020 - high peaks and low troughs, before the value levels off after some oscillation.
And then, because it's Tesla in 2020, the value begins to skyrocket again...
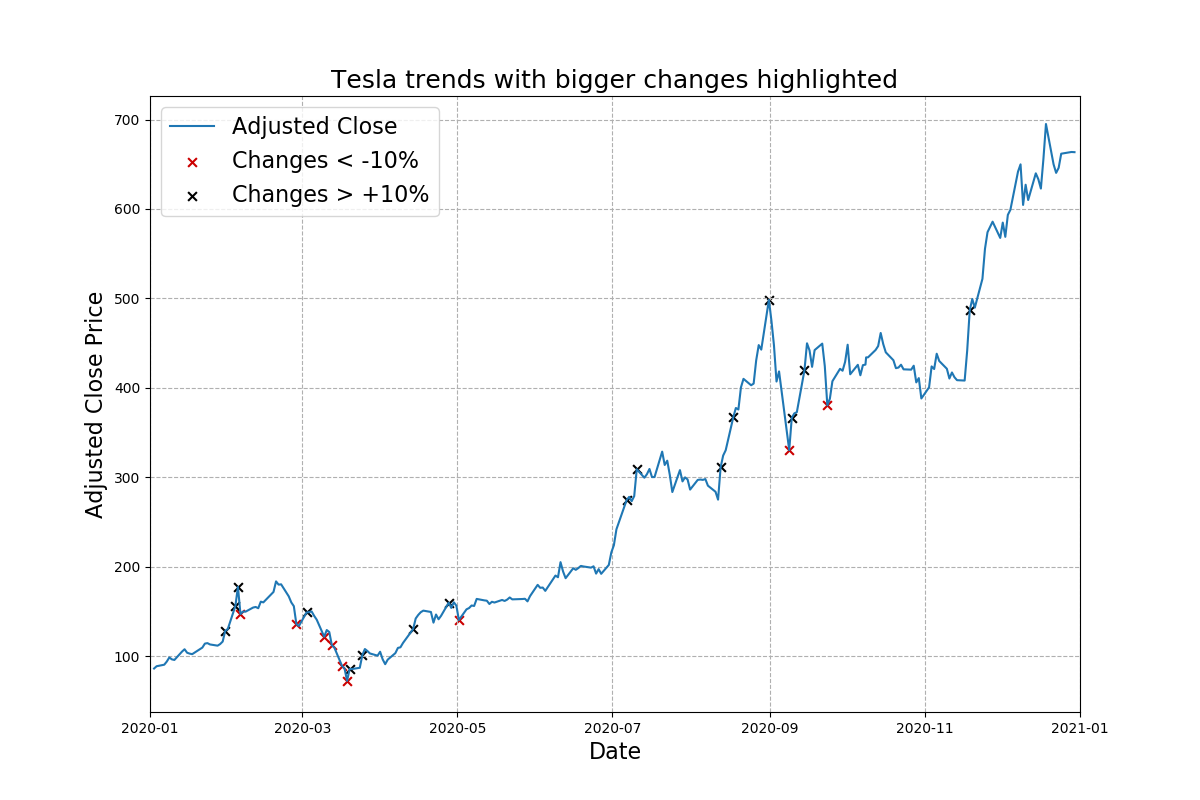
These high highs and low lows suggest that the 'market' believes the previous movement to have been too extreme, and that the current value is not a true reflection of the current value, so the market corrects itself. In doing so, it may over-compensate again, leading to more oscillations in value before stabilising on a middle value.
Can we predict big changes?
If we can recognise when a large peak or trough has occurred, maybe it can indicate when the next peak / trough will occur. We can then take appropriate action to take advantage of a potential opportunity. We can look at this by analysing a stock's movement over a given time-period to understand whether this can be used to predict the next movement.
I ran the numbers for this analysis over a range of day-periods, from one-day to five-days, and the strongest correlations were found with a gap of one-day, so that's what we will focus on here. This also makes most sense - if the stock market is over-reacting, we would expect it to re-adjust fairly quickly.
Right - enough chat, let's look at some results! Use the widget below to assess the relationship between a given day's stock market movement and the movement from the day before.
Correlations?
Tap or mouse-over any of the bars or circles to see associated information about each point. Orange = highlighted point, red = previous point.
Looking at the changes in stock prices between consecutive days, some trends emerge:
- The Stock Market indexes all have negative correlations, showing that (on average) an increase one day is typically followed by a decrease the next day.
- The best-fit lines all have gradients less than 50%, suggesting that the magnitude of the next expected movement is (generally) less than half of the size of the current swing.
- Tech stocks appear to have negative correlations (gain followed by drop, or vice-versa), whereas aviation stocks tend to have positive correlations (gains followed by gains, drops followed by drops).
- This suggests that tech stock values will tend to oscillate, whereas aviation stocks tend to compound.
One really interesting finding from this is that Tesla's stock correlation is 0.6%. If Tech stocks generally have negative correlations and manufacturing stocks have positive correlations, then this suggests that Tesla sits right in the middle of typical Tech & manufacturing stocks - which is exactly what their business is. Does this validate this model?
Is this a viable strategy?
I wrote a script to calculate expected returns to try and take advantage of these correlations. It's very simple - on any given day, if a stock's value moves by more than a threshold amount, then correlated action will be taken for the next day. As an example: Apple has a negative correlation, so after a gain we would typically expect a drop. Therefore, if Apple stock increases by more than X% on one day, it will be sold before the next day, and bought-back before the day after. The portfolio results across all stocks are shown below:
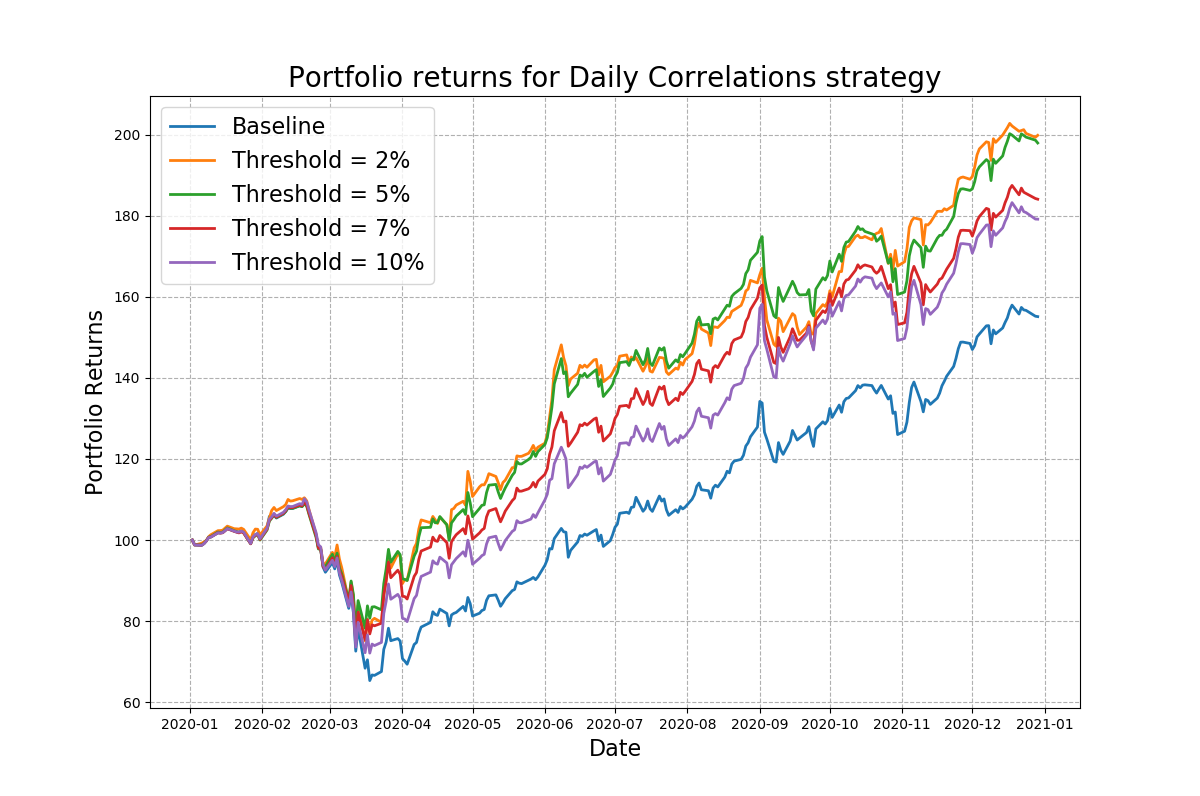
I ran the strategy for different threshold values for when to take action. It seems that values of 2% and 5% yield similar returns, which are around double the baseline yield (99% vs 55% for the stocks in the portfolio). In practice, using the 5% threshold is more practical as a) it reduces the number of trades which reduces any associated transaction costs, and b) a 5% change is a clearer signal and more likely to be robust. Stocks can vary by more than +/-2% on any given day for no significant reason.
So - based on trends in 2020, it seems like this is a very simple and very viable strategy. Maybe I'll revisit this approach in 2021 and let you know how I got on!
P.s. a couple of months after doing this work, I became aware of a paper by economists De Bondt and Thaler (1985) which agreed with my finding - that the stock market does tend to over-react. I thought this was pretty cool!
Disclaimer
Finally, let me issue a disclaimer: I make absolutely zero assurances about the quality of this analysis as a predictor for future stock values. It's your money and if you choose to invest it in any given stock, you do so entirely at your own risk. Only an idiot would follow investment advice from a random website without first testing strategies for themselves.
Furthermore - 2020 has been a very volatile year for the stock markets, and there is no guarantee that such trends will continue in 2021.