What is Pairs Trading?
Pairs trading is when the movements of two stocks correlate strongly, they can be used to predict movement in each other. It goes without saying that any way to predict future movements of stocks leads to an opportunity to increase returns. If you can predict that a stock will increase in value, then you can buy more of it to increase your portfolio value. Similarly, if you can predict that a stock will go down in value, you can sell it earlier to reduce losses.
The actual dollar value of any given stock is totally arbitrary and is affected by a wide range of factors. However, the relative movements of certain stocks can be seen to be correlated with one another, usually different stocks within the same sector e.g. Tech stocks or Aviation stocks. This correlation of stocks is one of the fundamental principles behind the Nobel Prize winning Capital Asset Pricing Model in economics.
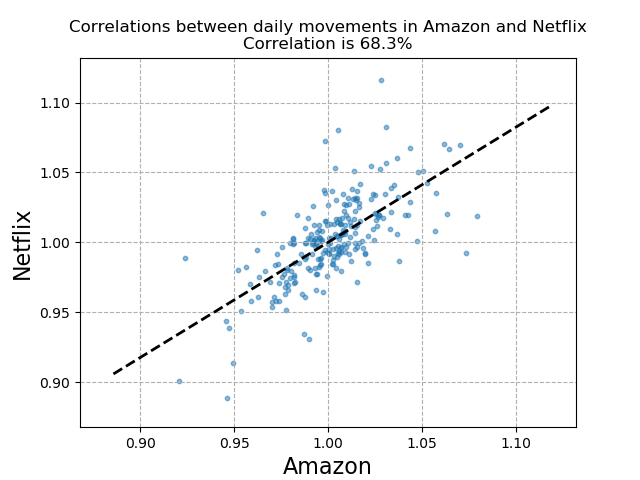
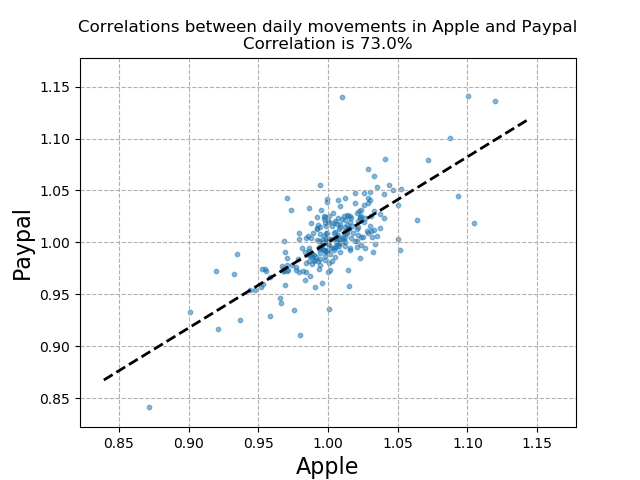
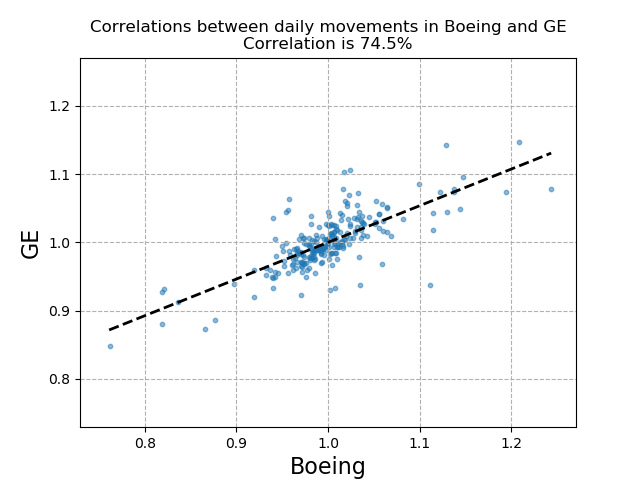
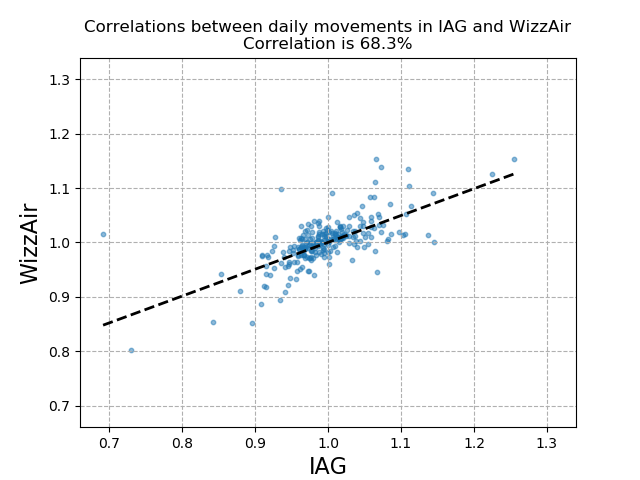
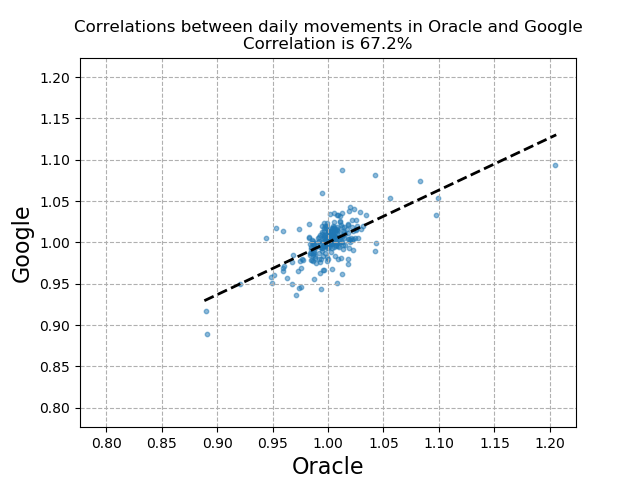
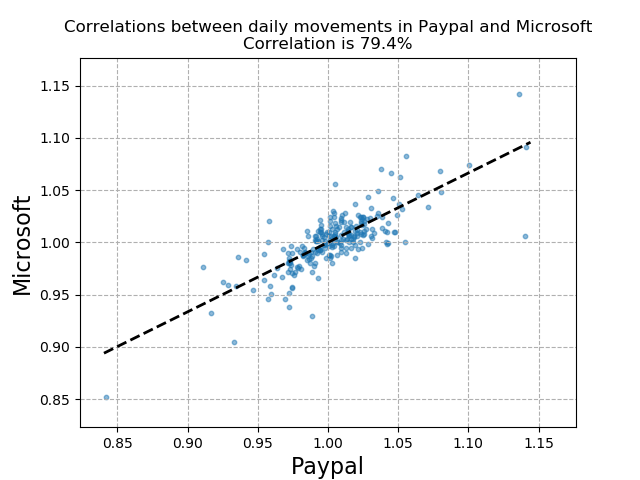
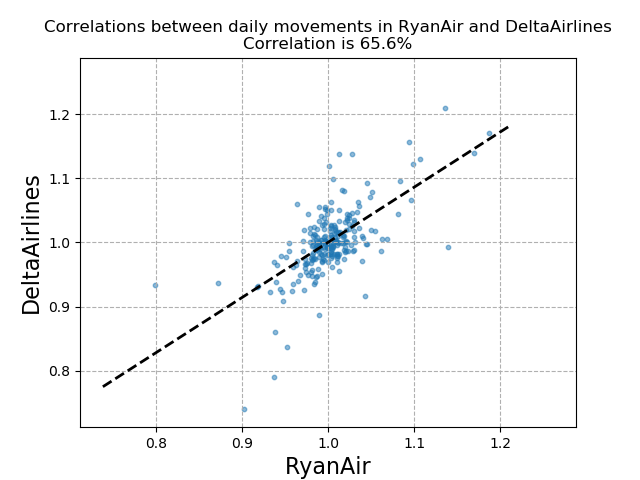
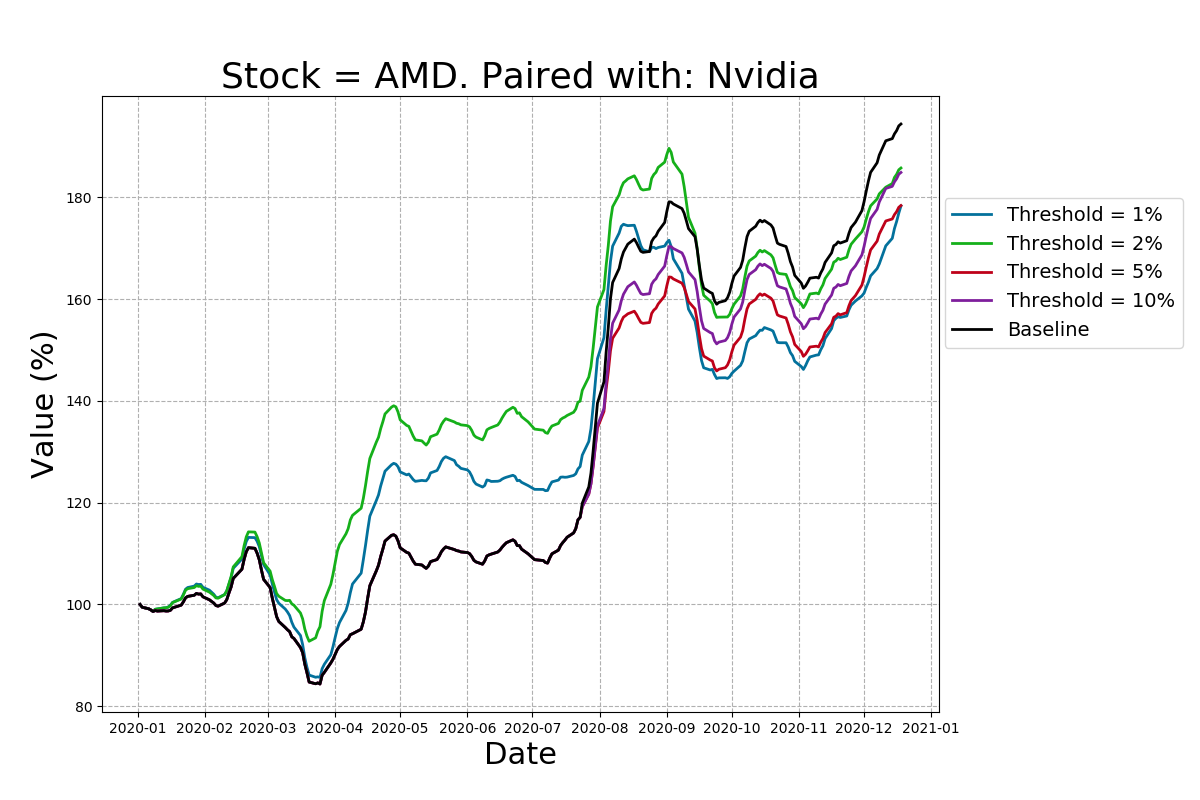
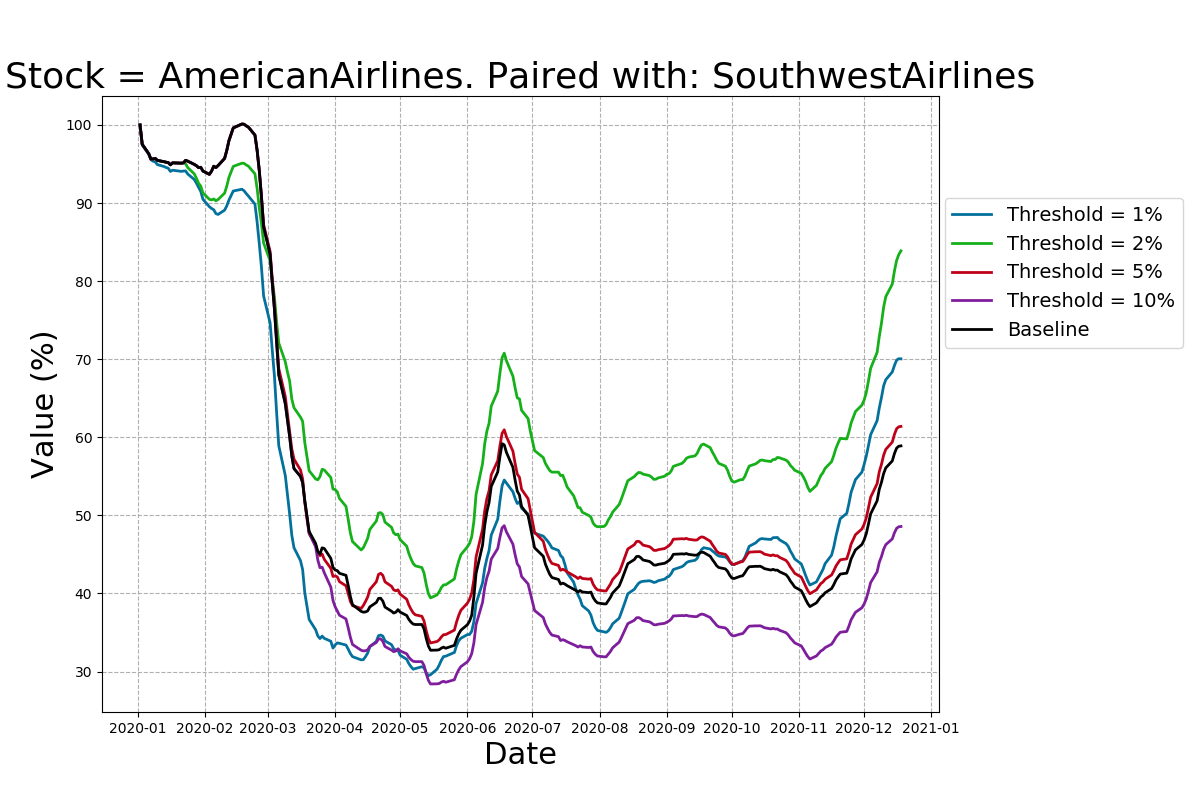
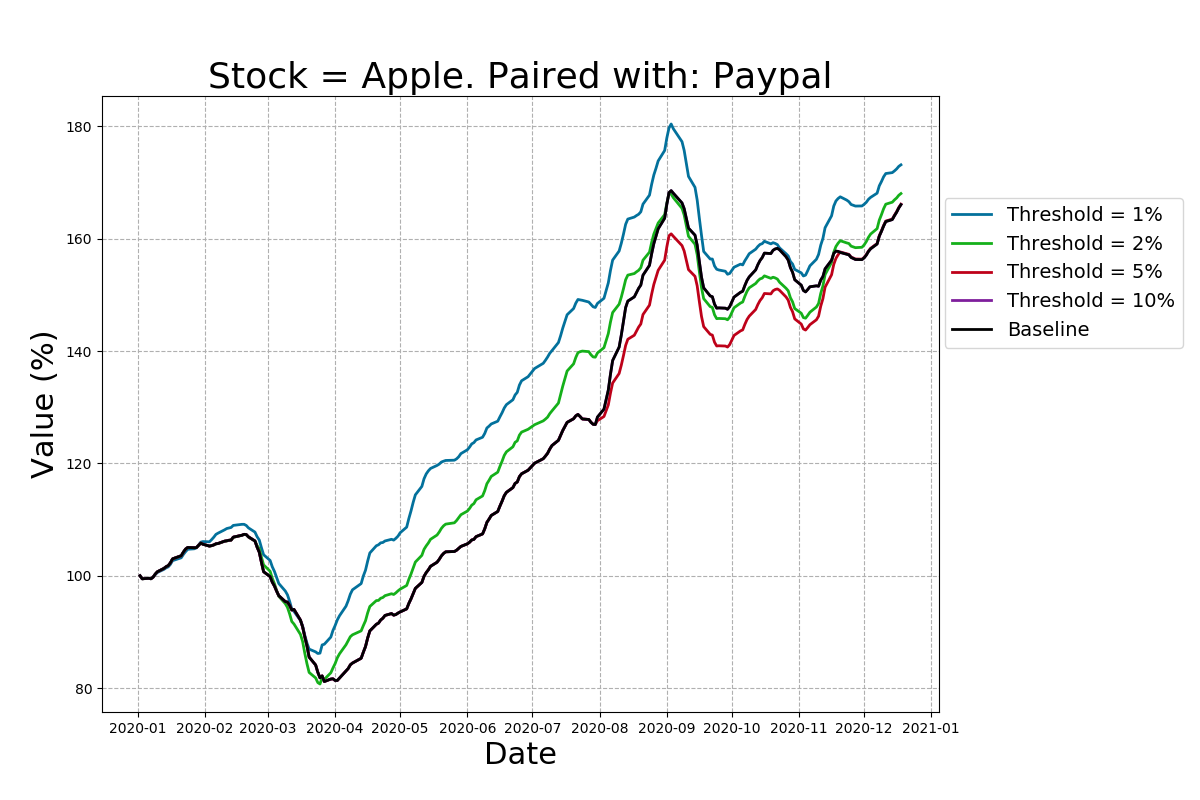
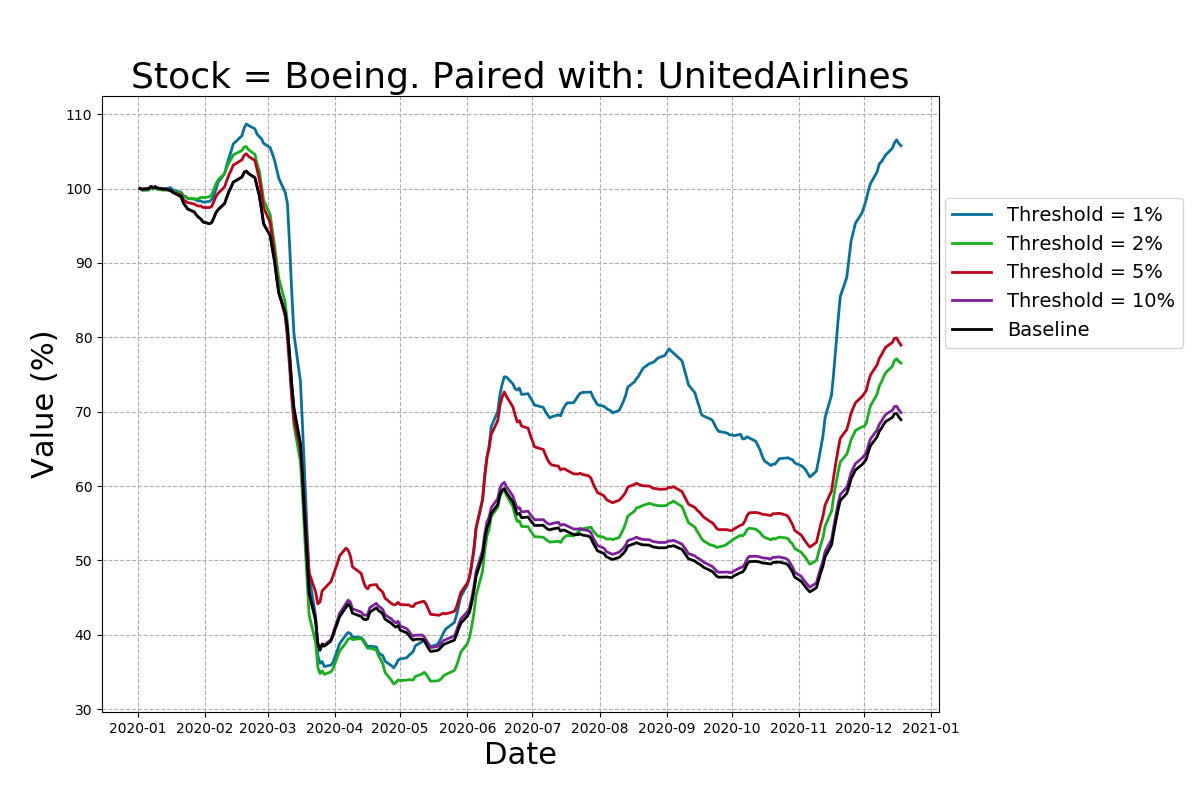
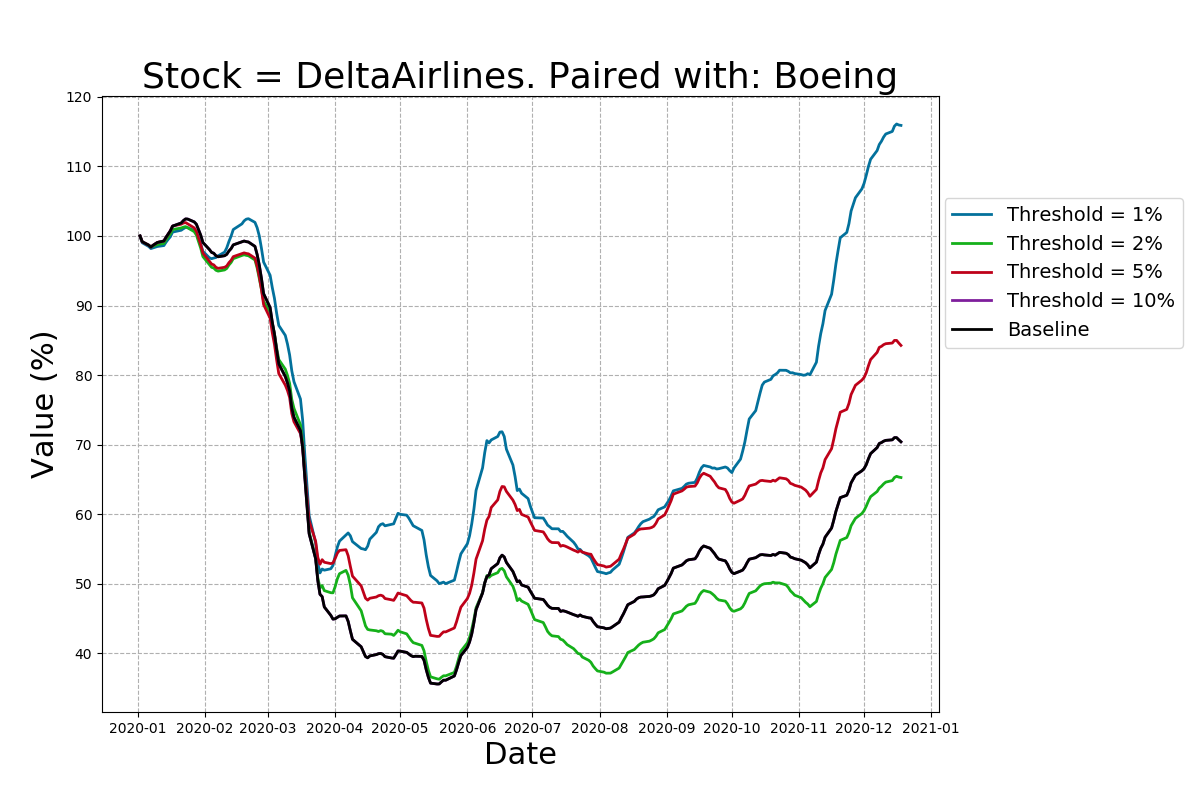
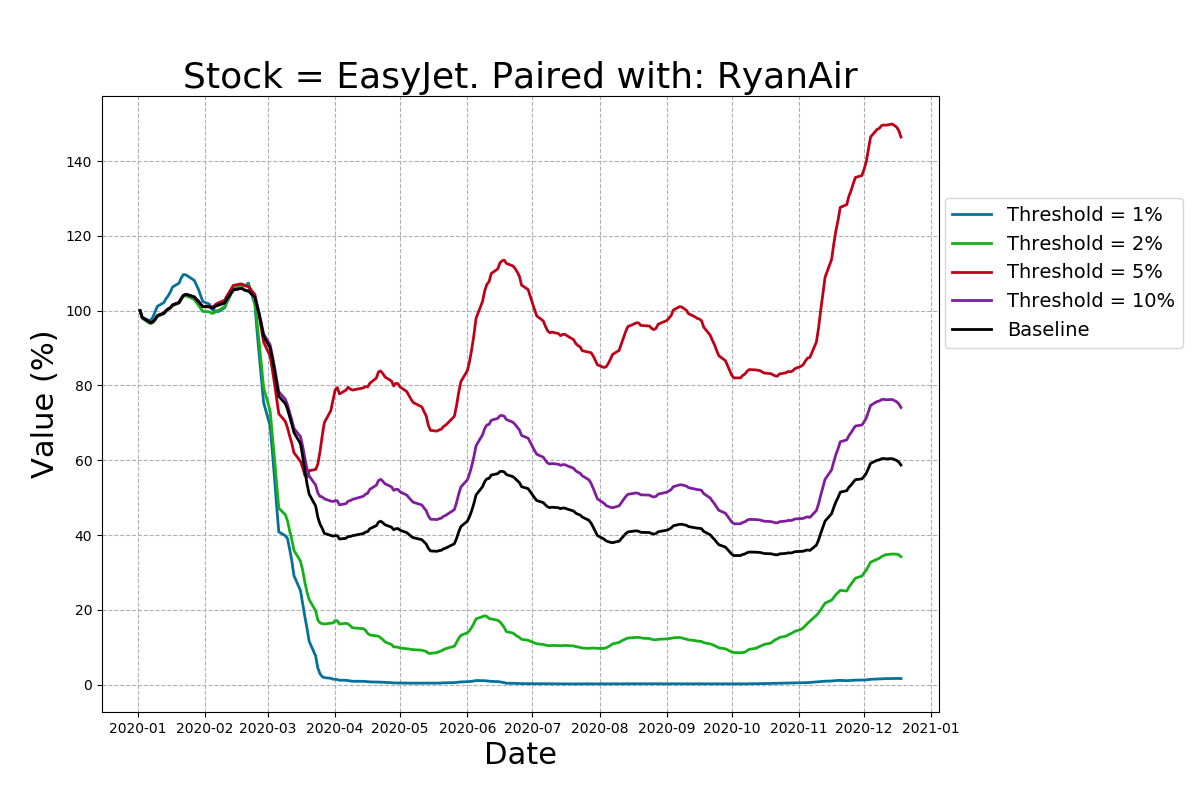
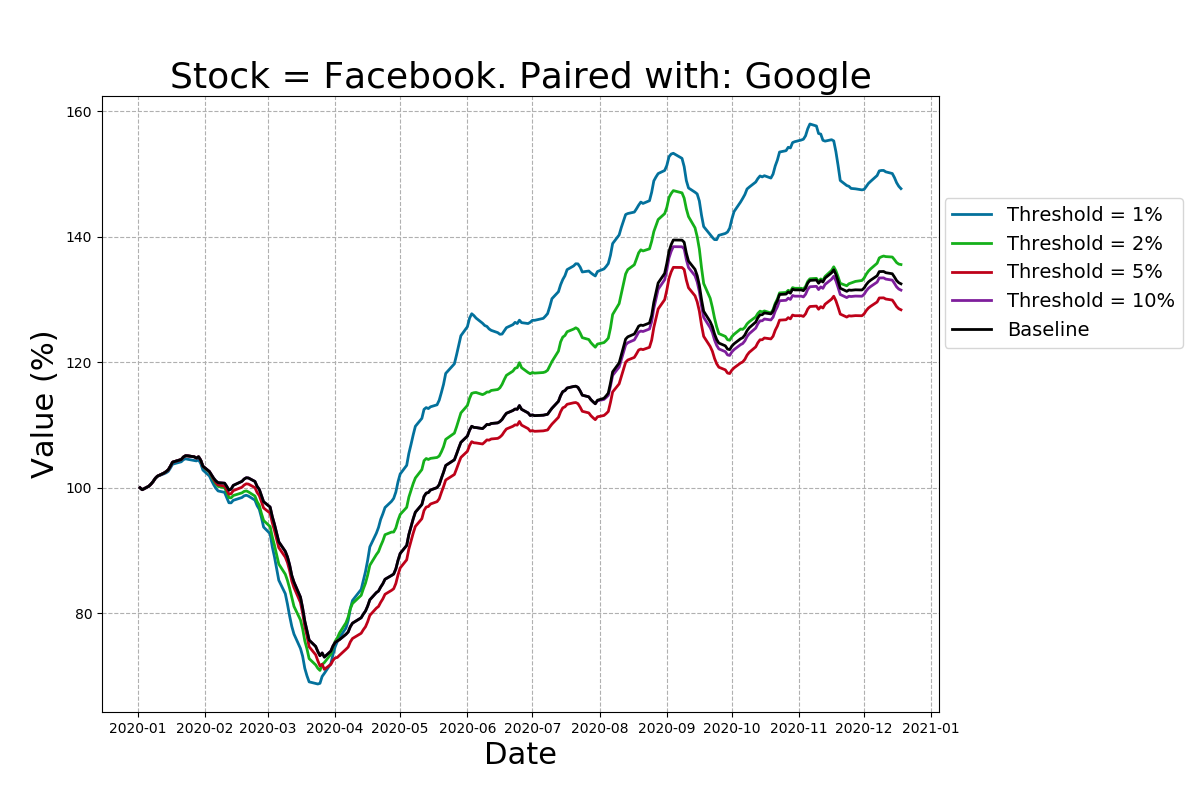
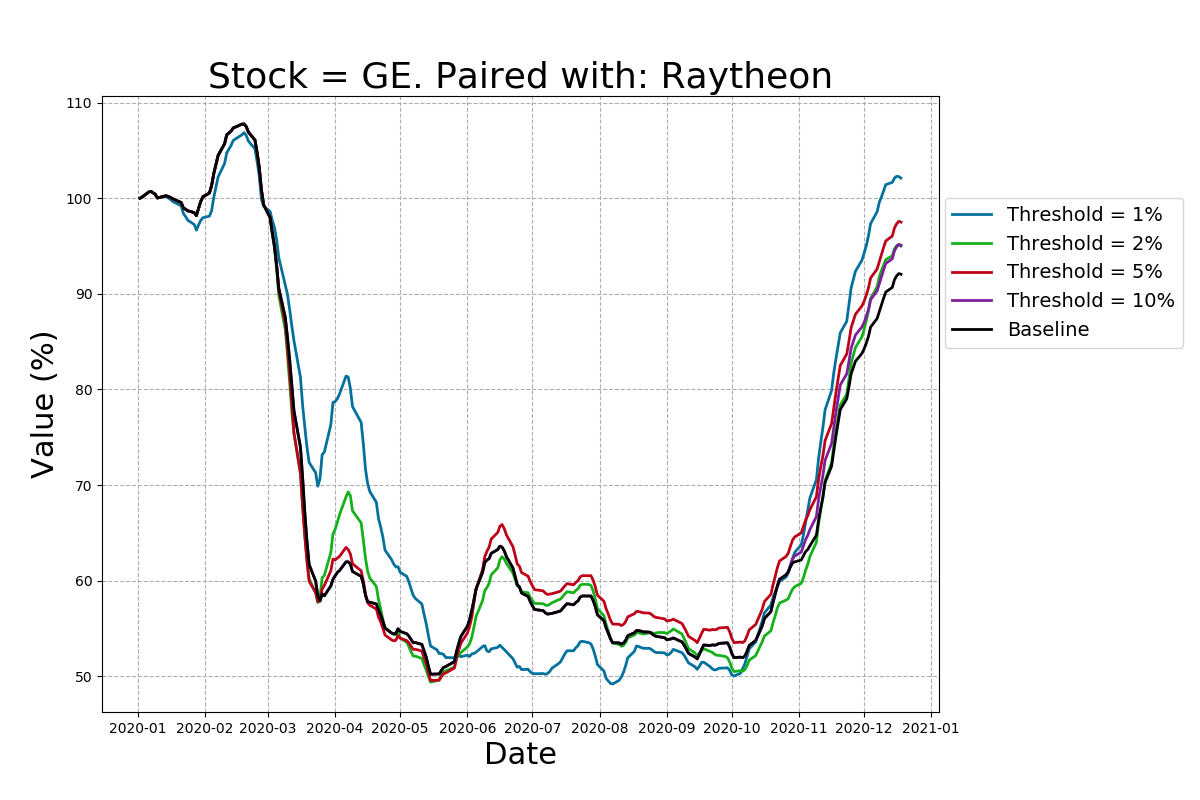
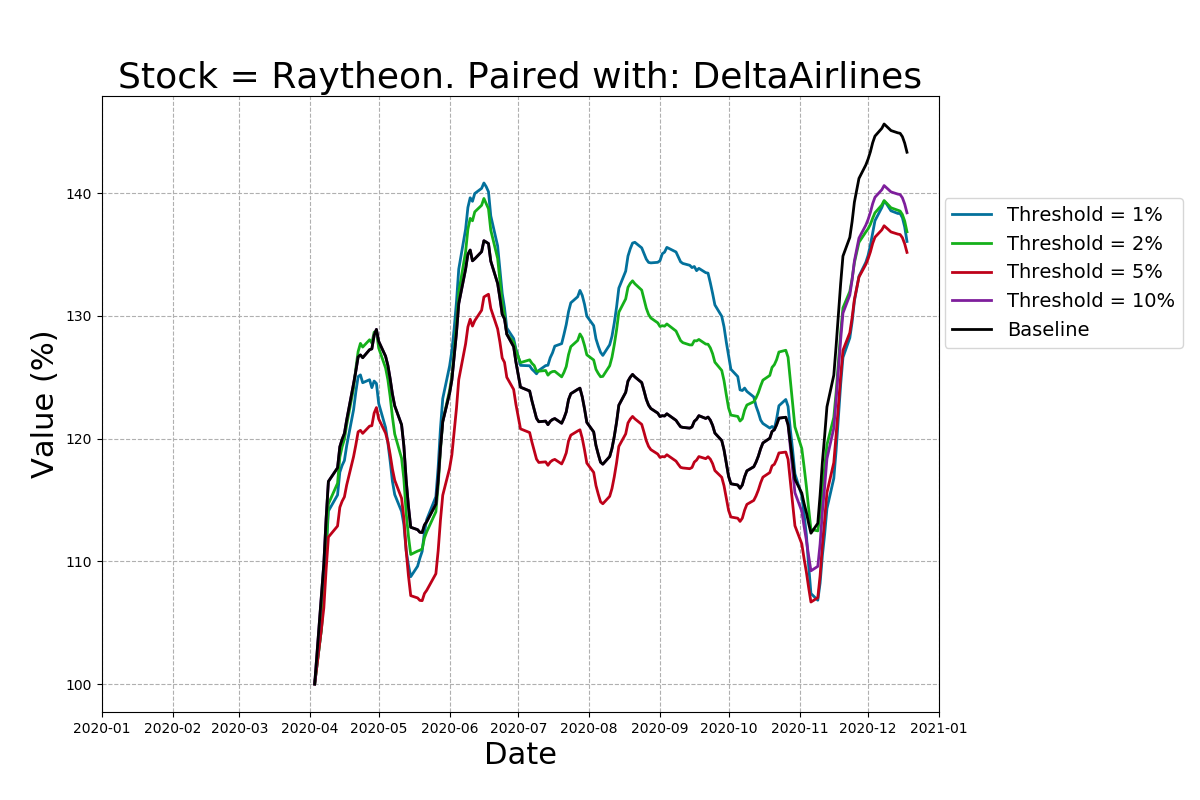
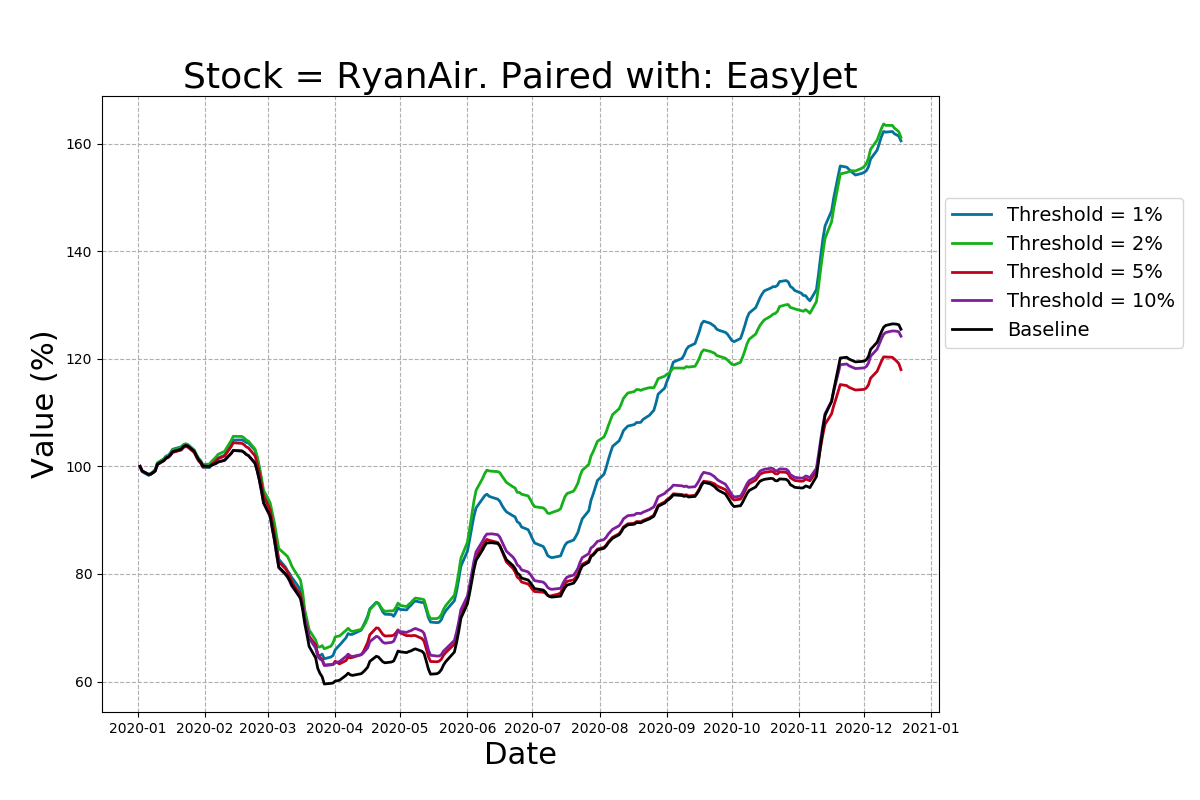
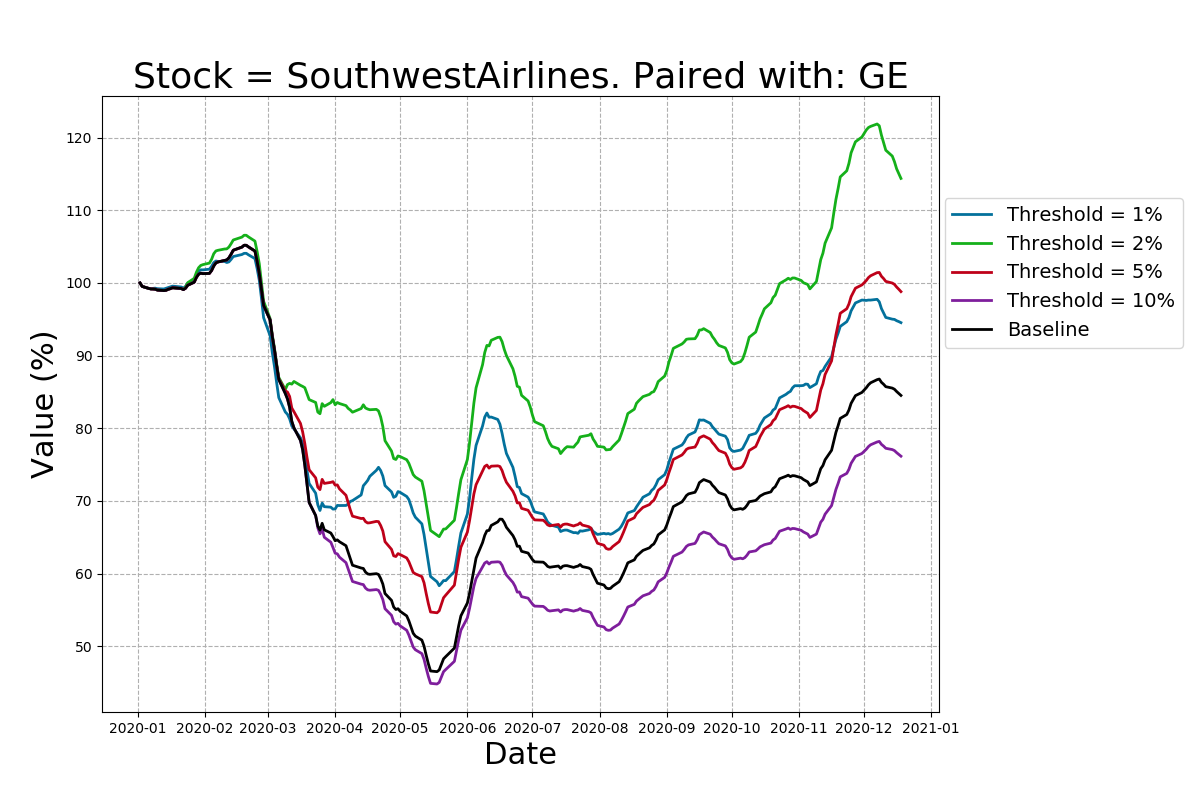
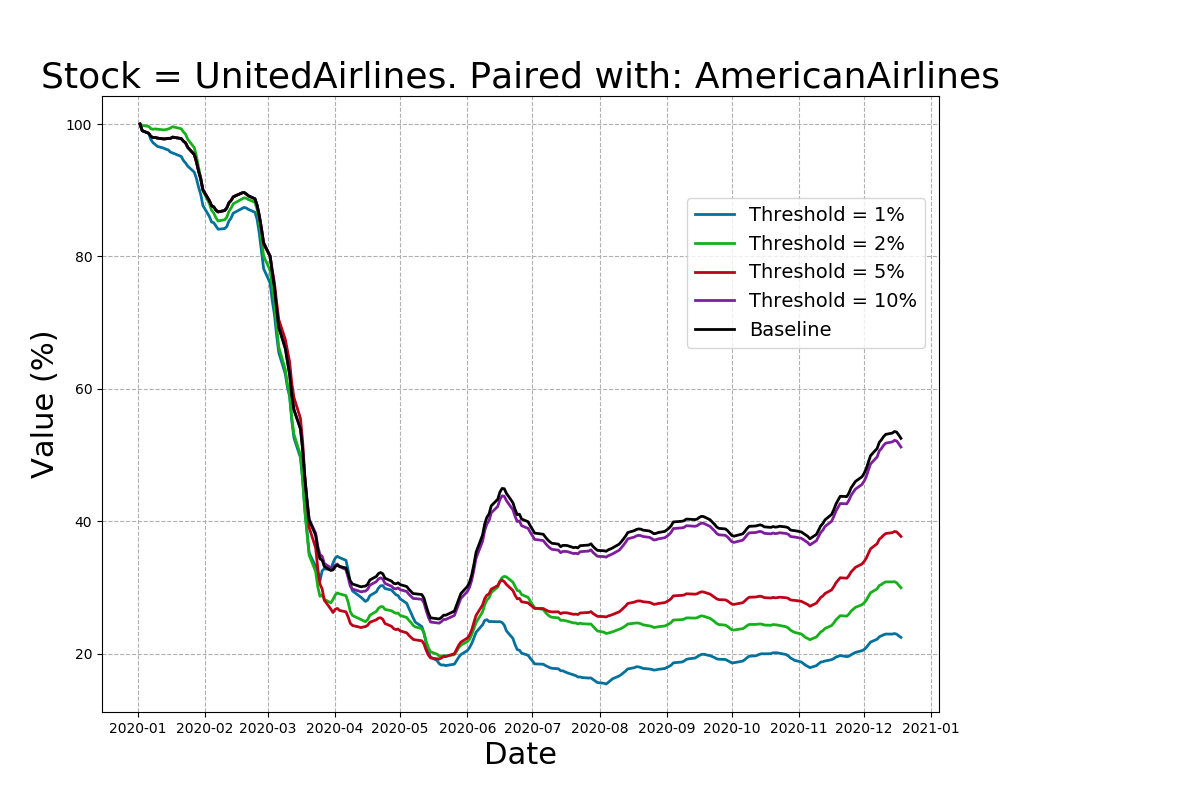
For example: below are the daily movements of various correlated stocks between 1-Jan-2020 and 18-Dec-2020 in the Tech and Aviation sectors. 2020 has been a highly volatile year for stocks across many areas, which makes it a good dataset to test a pairs-trading strategy.
How can we use this information?
So - say that stocks A and B are strongly correlated. This means that similar movements have been observed between the daily closing prices of various stocks. Therefore, if we detect a change in stock A but not stock B, we suspect that by the end of the day that stock B will have moved in a similar direction to the current value of stock A.
- If stock A has increased, we want to buy stock B to increase our expected returns.
- If stock A has decreased, we want to sell stock B to reduce our expected loss.
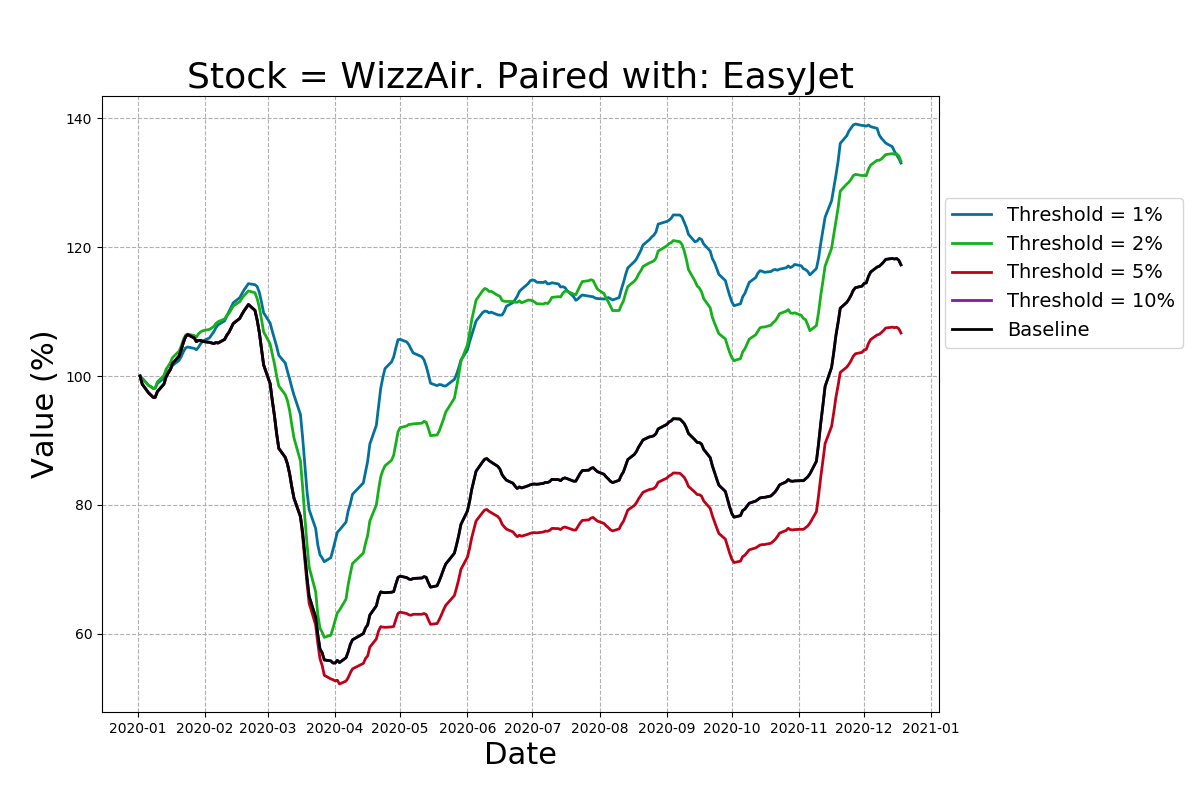
To test this approach, I analysed a selection of stocks from 1-Jan-2020 to 18-Dec-2020. For every stock, I found the other stock that it correlates with most strongly. If the correlation exceeded a given value (say 60%), then it is used in the algorithm. Comparing the hourly values of the stocks - if the difference in movement between the stocks exceeds a threshold value, this triggers the appropriate action in the correlated stock (buy or sell). For simplicity and comparability, the stake in the current stock is simply shifted to the correlated stock, and the portfolio stakes are reset at the end of the day. Transaction costs of making trades are assumed to be negligible.
Note that this approach has some configurable parameters - a minimum correlation requirement for stocks to be included in the algorithm, and a threshold stock difference, movement above which triggers a buy / sell action. A lower threshold value indicates lower potential to improve returns but more trades will be made, which may increase potential to improve returns. It seems likely that there's an optimal threshold value.
Right - apologies for the long technical paragraphs but hopefully that outlines the approach clearly enough. Let's see some results!
Results
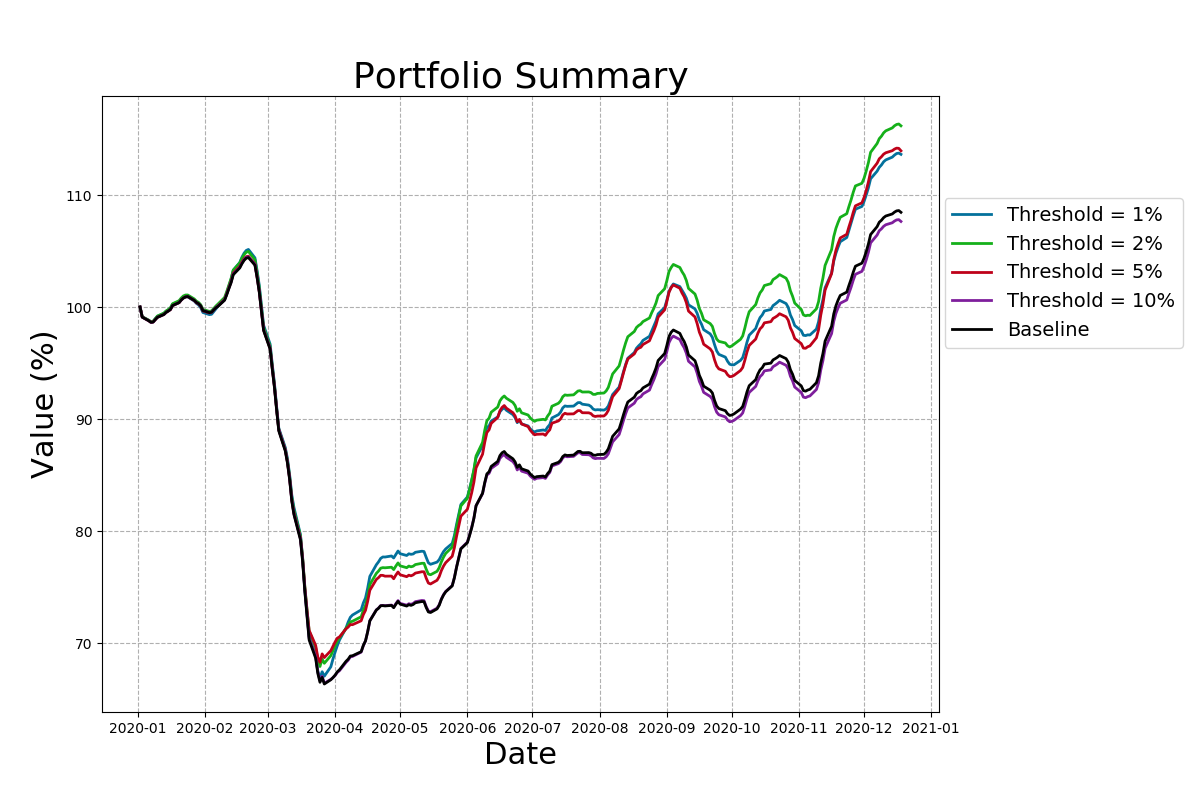
Overall, the results are positive. For a portfolio consisting of equal weights of all the stocks I have assessed, this pairs-trading strategy can almost double the returns over the baseline position of the portfolio (i.e. with no trades). Portfolio results are outlined below:
- Baseline - returns 10.3% (0 trades).
- 1% Threshold - returns 15.6% (3,979 trades).
- 2% Threshold - returns 18.0% (1,361 trades).
- 5% Threshold - returns 15.6% (205 trades).
- 10% Threshold - returns 9.4% (23 trades).
- The 10% strategy is the only one which returned less than the baseline.
- This in itself in an interesting result because finding a 10% swing between two correlated stocks should be a strong indicator of future movement in the correlated stock. This result suggests that significant movements may actually "bounce" back to less extreme positions, and that taking action after such large movements actually denies us the catch to benefit from the bounce-back. This is a topic for a separate blog.
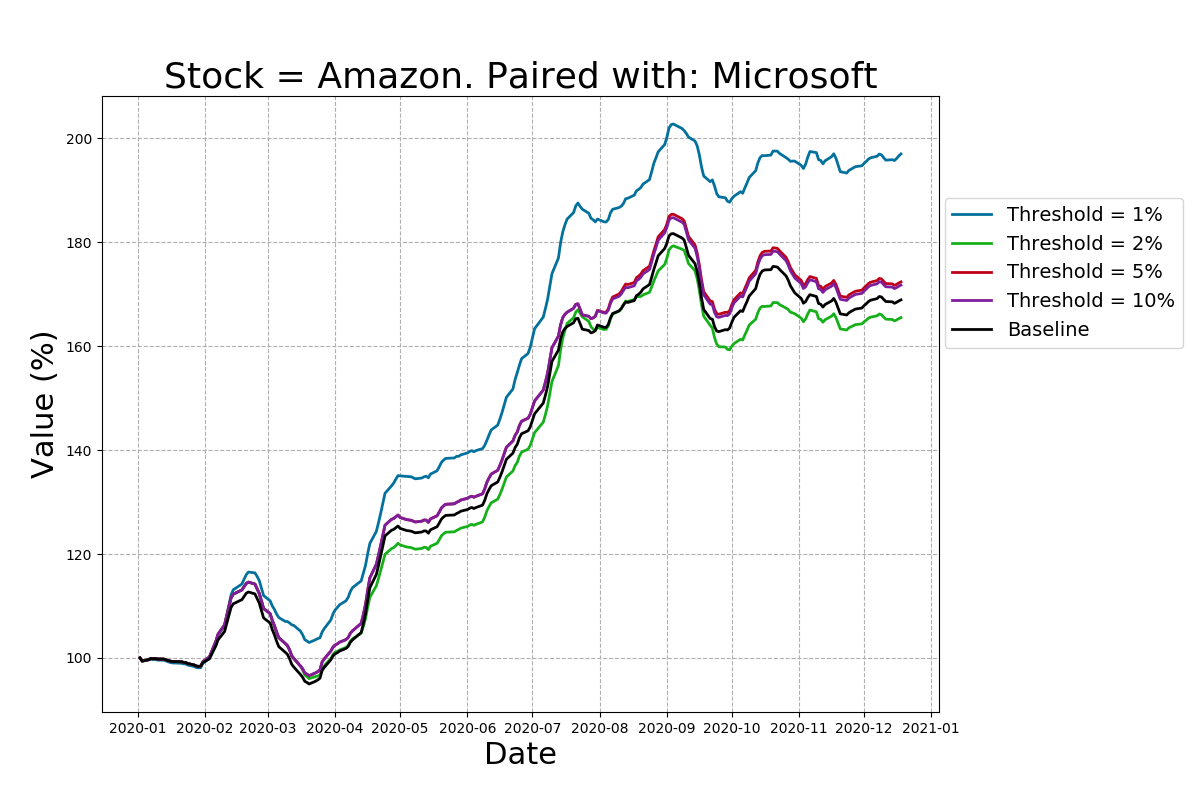
Across the full portfolio, it seems many of the strategies have similar returns. However, there are significant discrepancies between individual stocks within the portfolio. It is entirely possible that certain stocks generally move before other stocks, so these quick-moving stocks can be used as indicators for actions to be taken on other stocks.
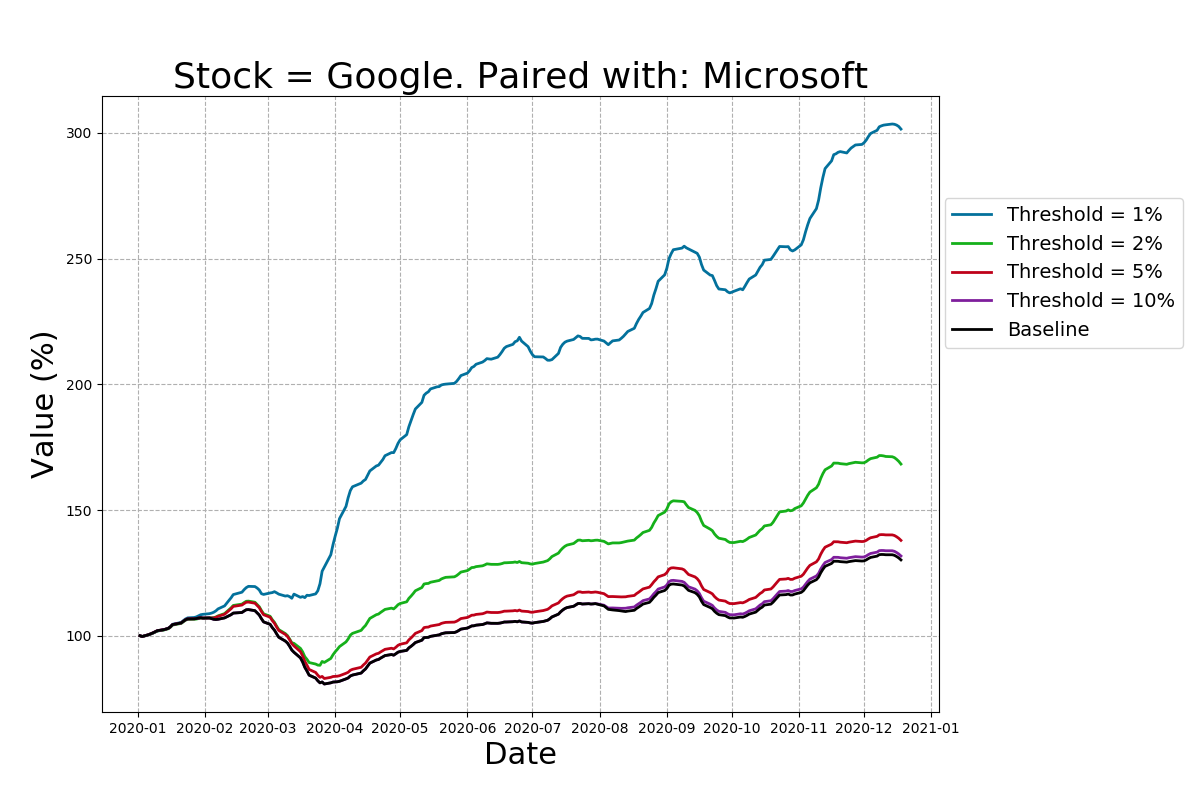
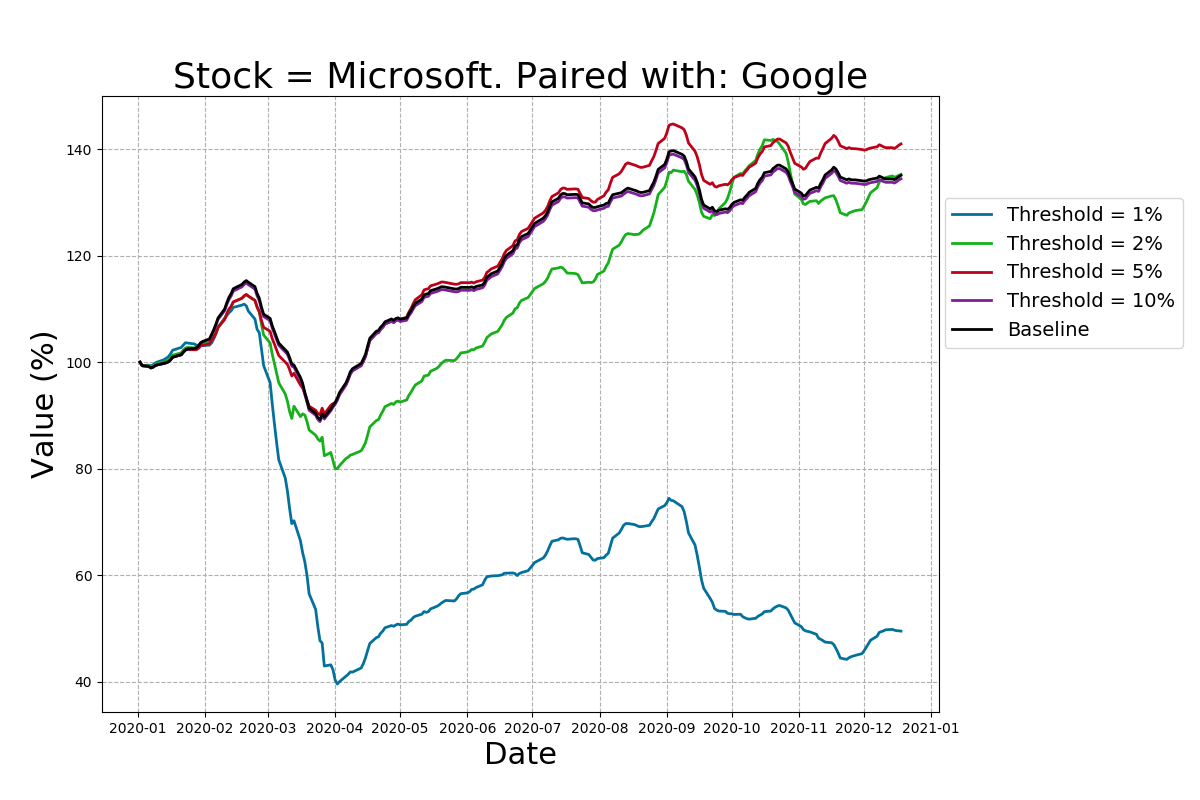
For example, look at the vastly different returns for each strategy between Google and Microsoft. Note that both stocks are being used to predict the other's movements, which is nonsensical in itself. It seems that movements in Microsoft's stock value can be used to predict movements in Google's stock value, leading to significantly increased returns when speculating on Google's stock, but the same strategy (implemented by the exact same code!) leads to a marked reduction in returns when speculating on Microsoft's stock.
The conclusion here is that the value of Microsoft's stock moves more quickly than Google's stock. In such a case, we would use the strategy to judge the position to take on Google's stock but not Microsoft's. In this way, we could achieve the baseline returns on Microsoft's stock and the increased returns on Google's - the best of both worlds.
Optimised Results
Taking the best strategy for each stock individually, the portfolio returns have been recalculated and are shown below:
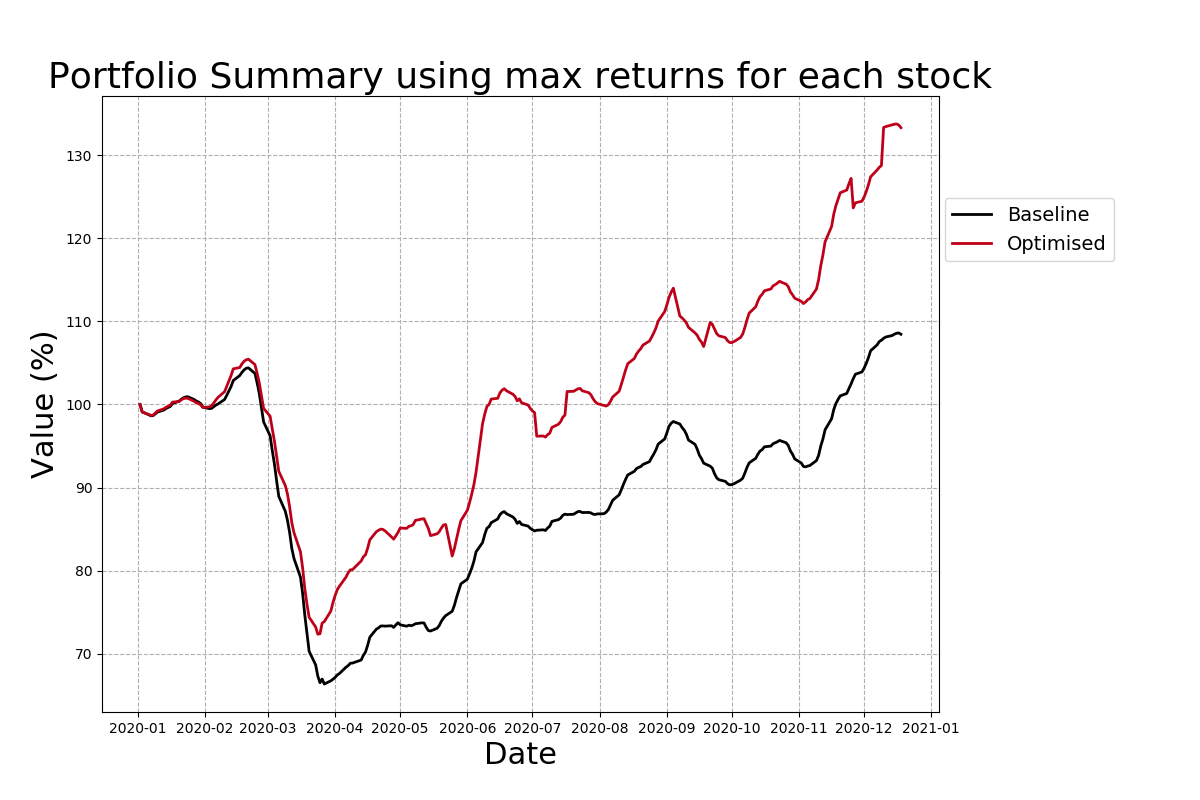
This optimised strategy would have lead to a whopping 32.1% return in 2020, more than 3 times the baseline returns! Whether or not these results will continue into 2021 is a topic for another post. However, this shows the power and potential of quantitative analysis when speculating on financial markets.
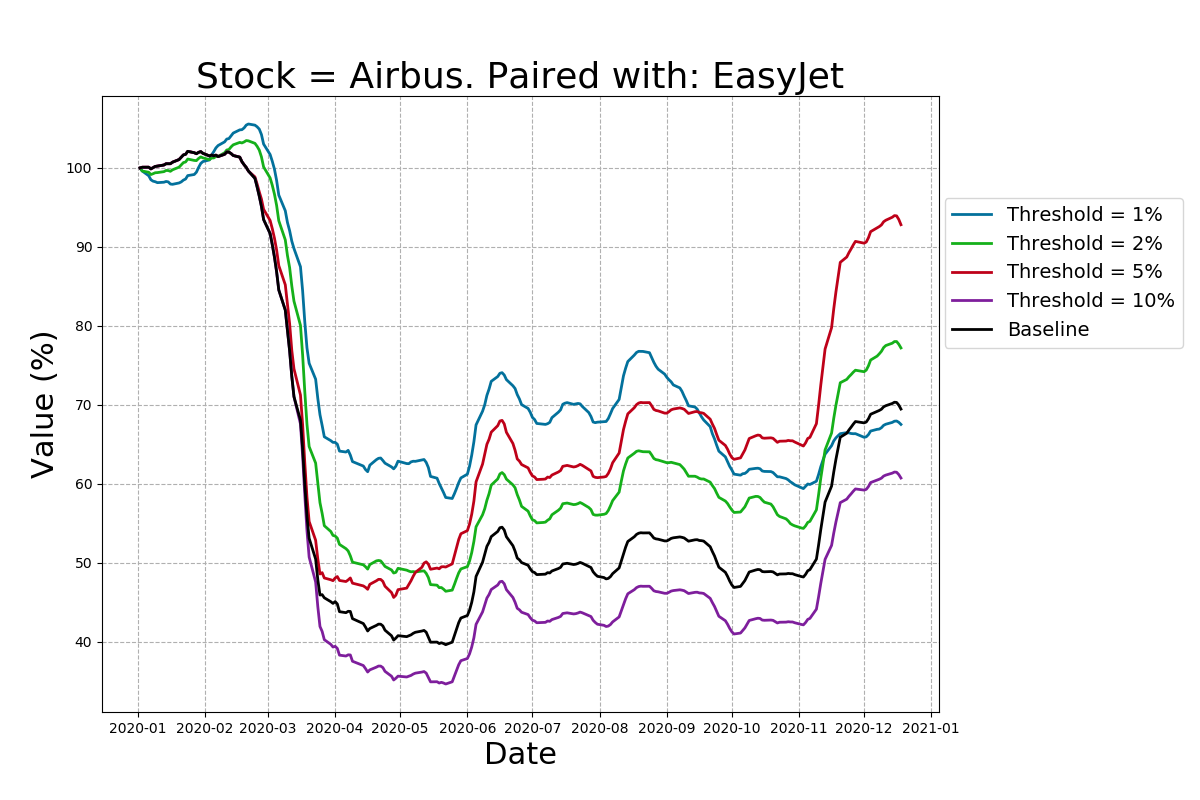
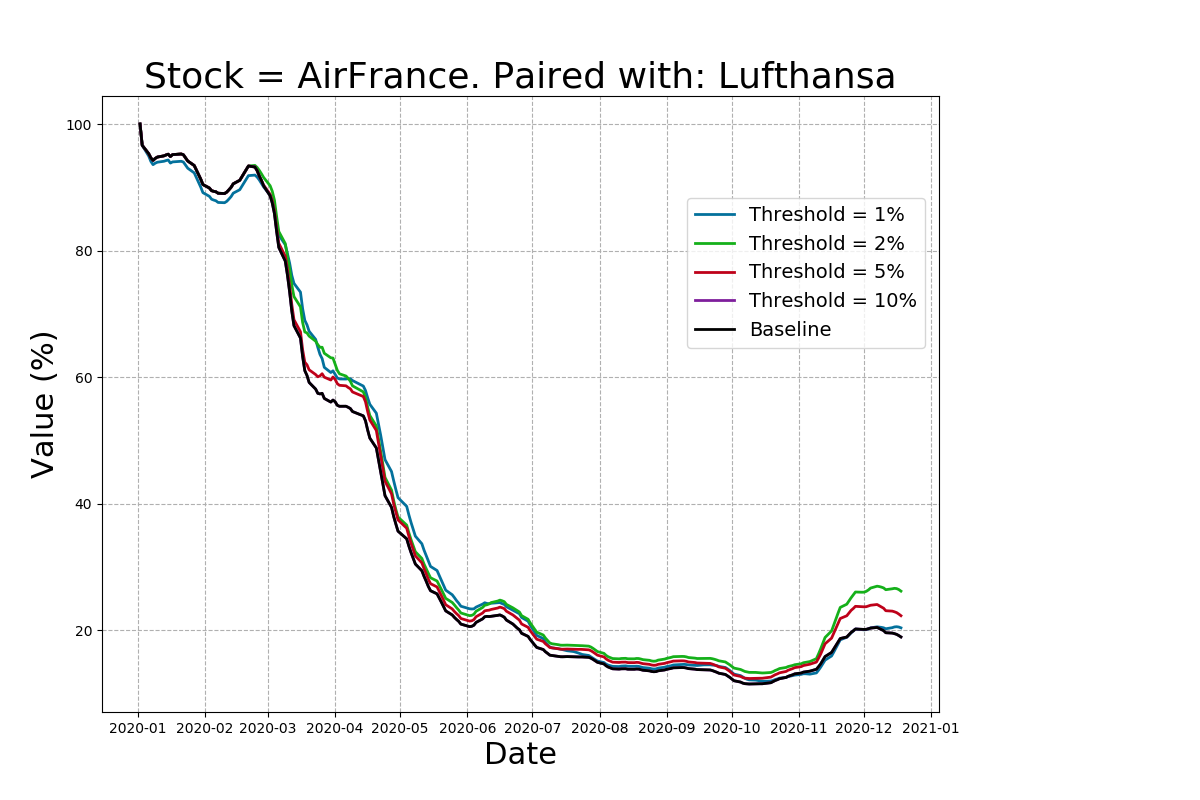
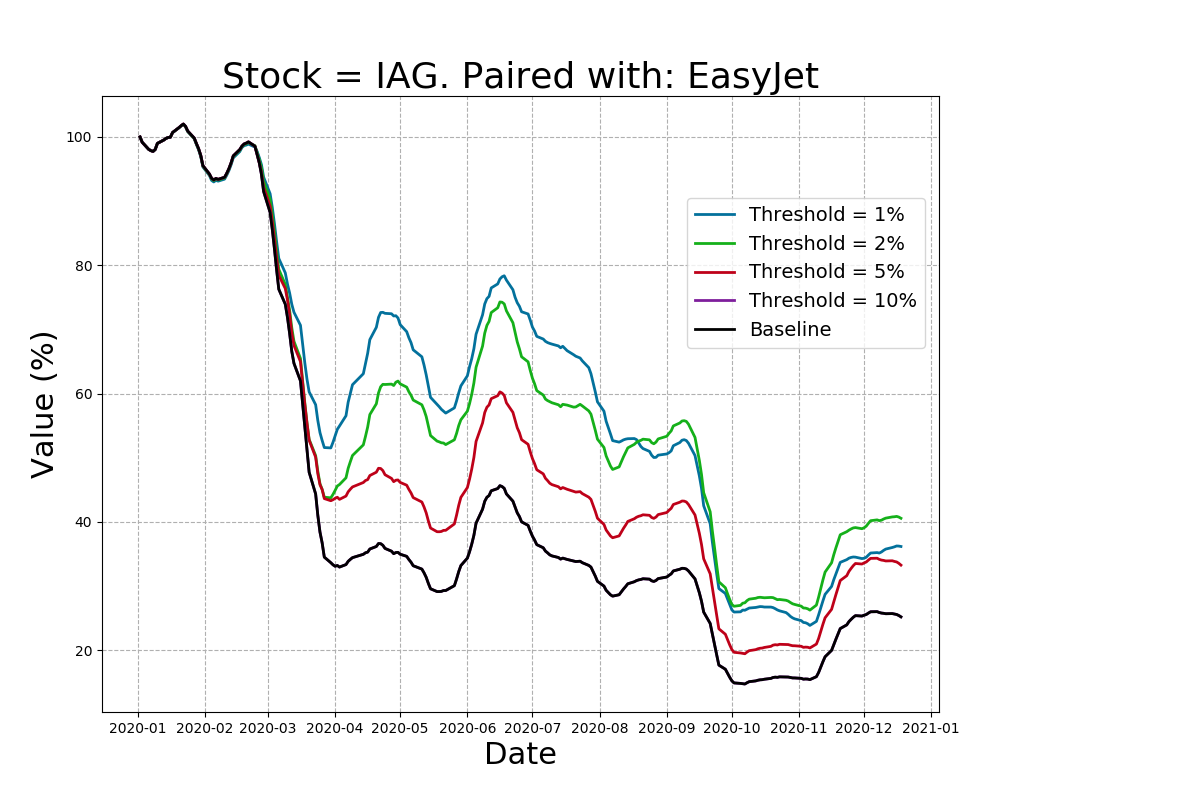
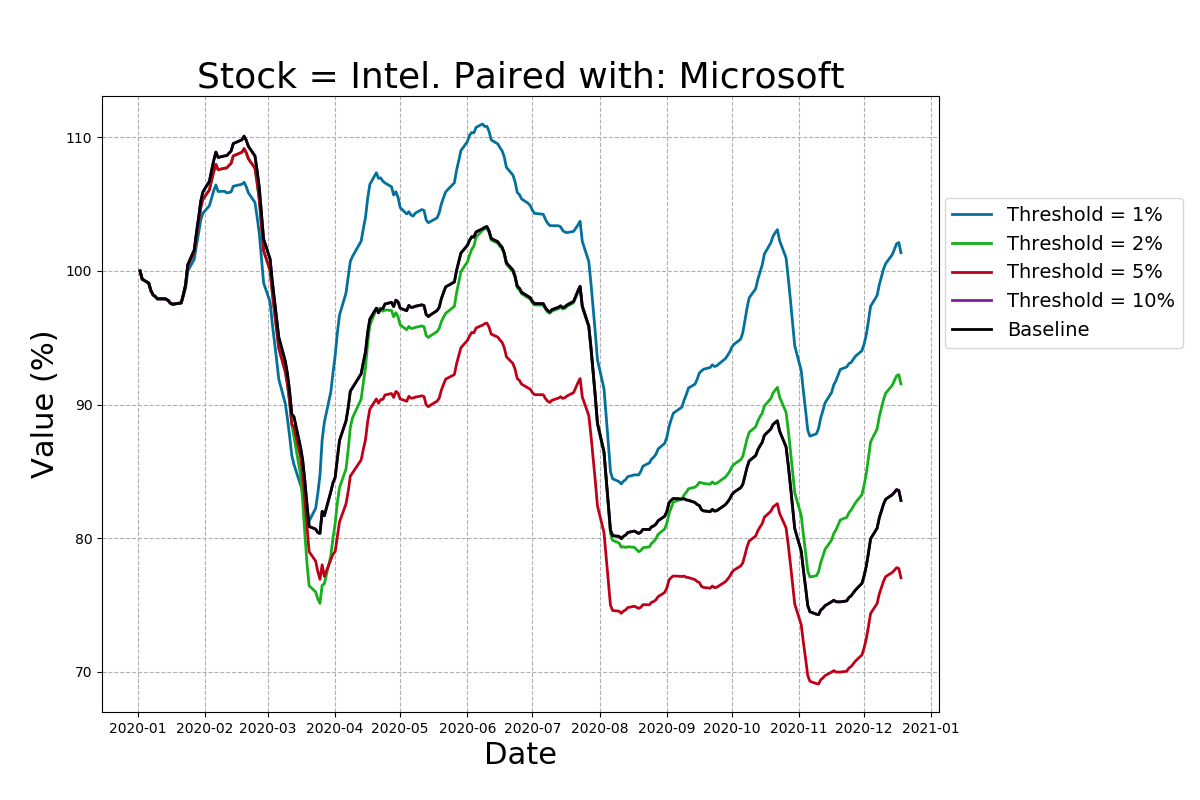
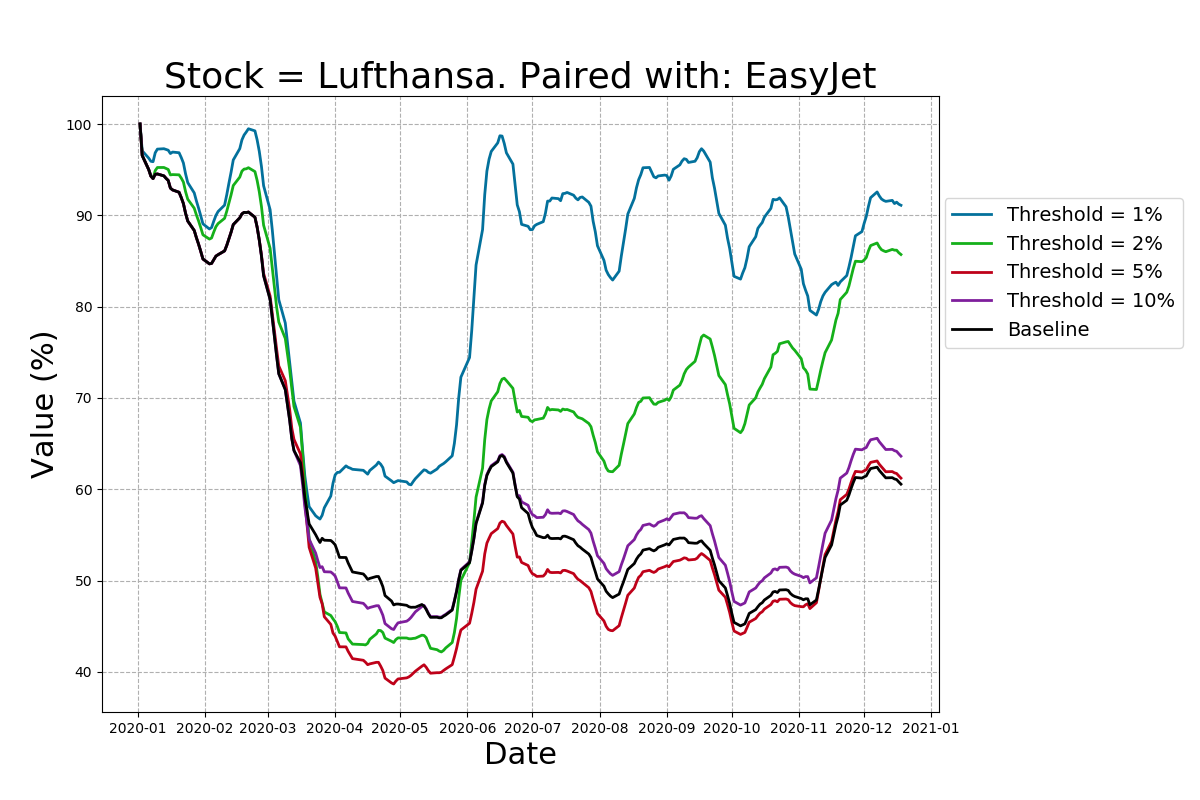
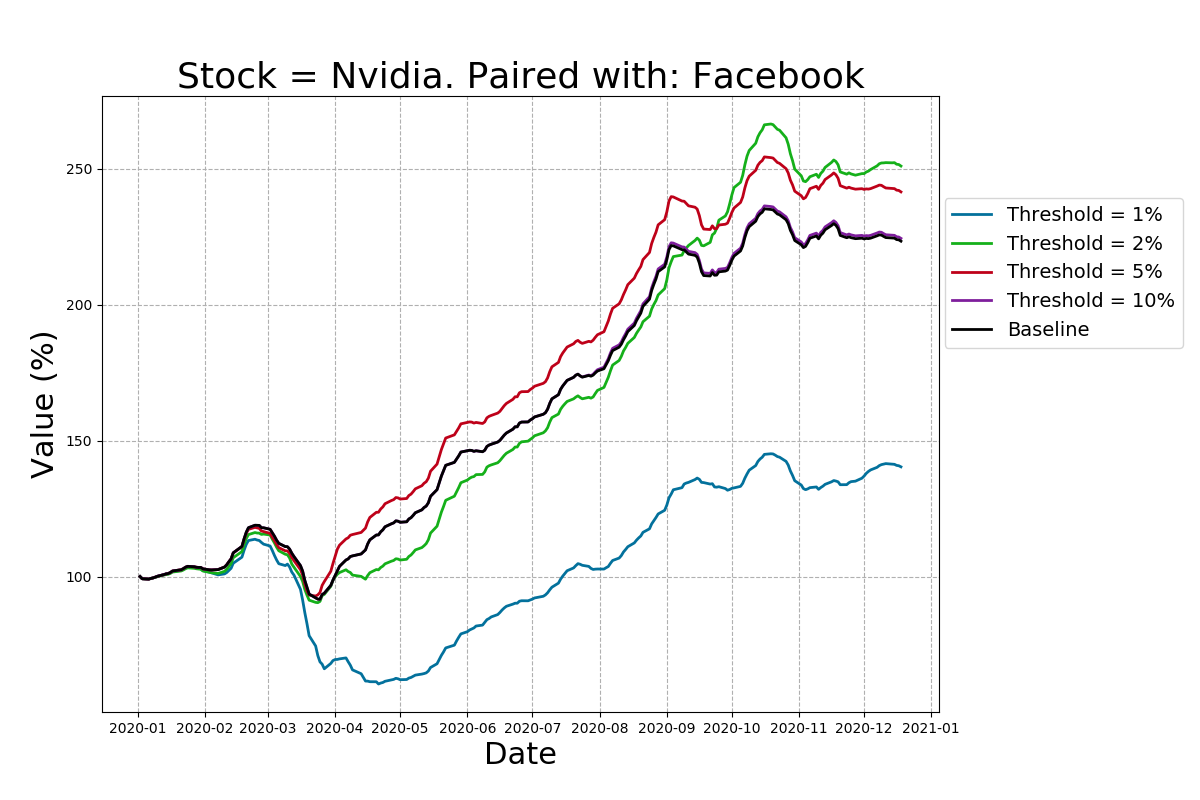
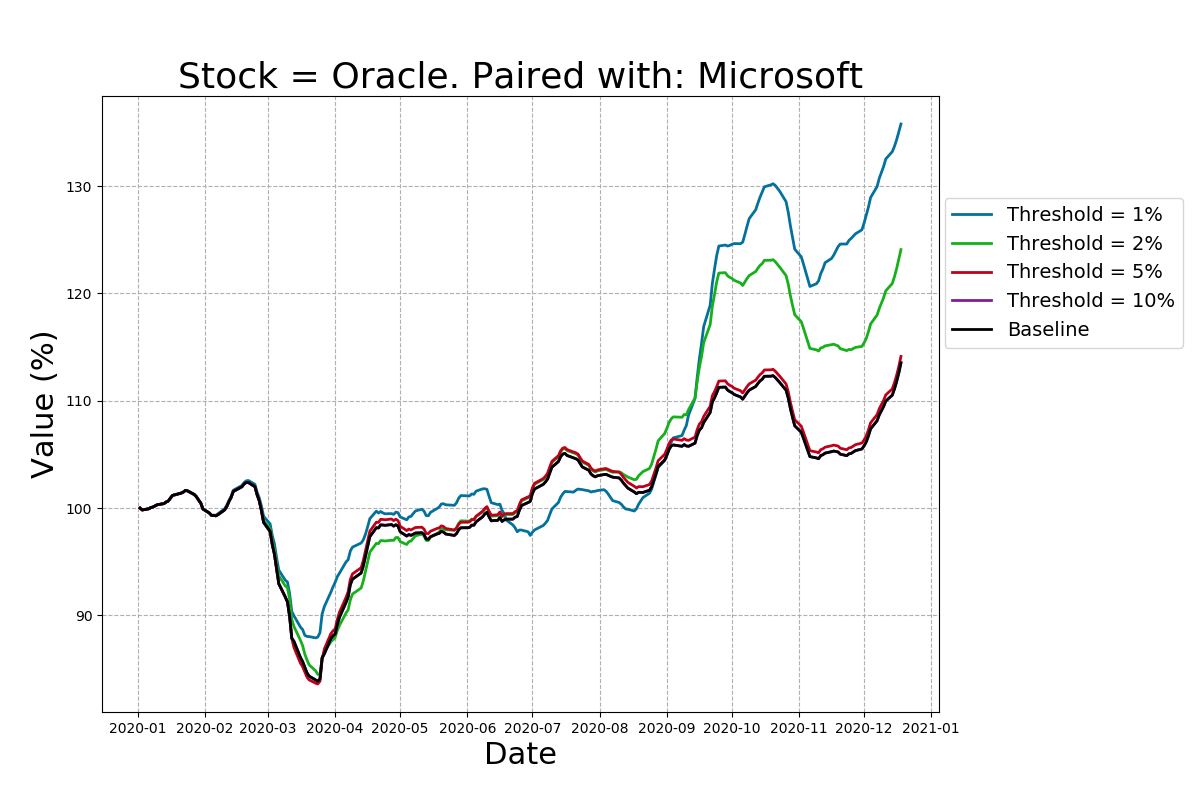
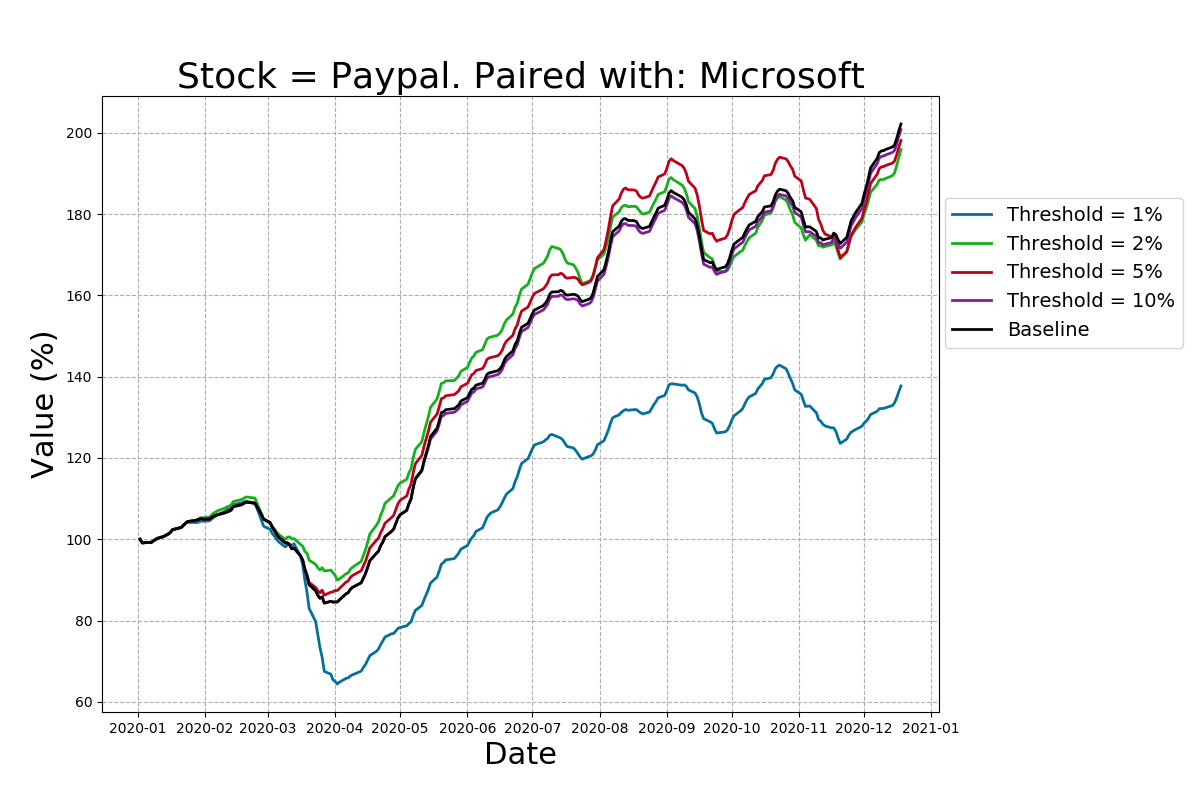
For info, the returns of all stocks analysed are shown below:
Next steps
Brb, off to setup some algorithmic trading...
Comments
No comments yet.